Overview
Procedure
Toolbox

Anchoring Phenomenon

Numerous reports suggest an increase in white shark encounters* in the United States in recent years and the public is worried.
*Encounters include sightings and census estimates, as well as physical interactions between humans and sharks.

Lesson Concept

Analyze and interpret patterns in shark fossil data to document the existence and diversification of white sharks from their ancestors to estimate historical population size for use in revising an explanation of causes of recent increases in the white shark population.

Investigative Phenomenon

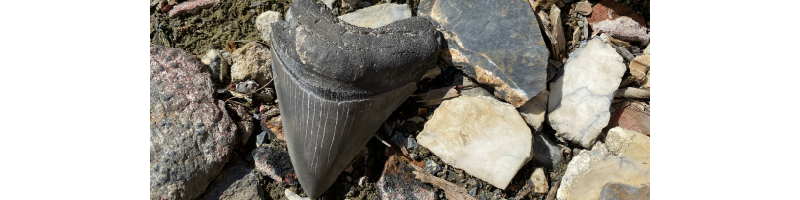
Fossil shark teeth can inform us about the past.

Standards

Click here for NGSS, CCSS (ELA), and California ELD standards.

Time | Materials | Advance Preparation

Time

90 minutes

Part I25 minutesEngage
Part II30 minutesExplore
Part III35 minutesExplain

Advance Preparation

  1. Make sure that 8.1.C1: Shark Encounter Claim Chart from Lesson 8.1: Shark Encounters, is posted in the room.
  2. Prepare three charts to use during the lesson: Shark Population Questions Chart, Shark Fossil Assumptions Chart, and Shark Teeth Data Chart.
  3. Review video Tips for Finding fossilized shark teeth! At the beach! (Step 2 of Procedure)
  4. Duplicate (and possibly laminate) one set of 8.2.G1: Expert Group Cards for each group of 4 students. (Step 3 of Procedure)
  5. Duplicate (and possibly laminate) one set of 8.2.G2: Time Scale Cards for each group of 4 students. (Step 3 of Procedure)
  6. Duplicate 8.2.H1: Geologic Time Scale for each student. (Step 3 of Procedure)
  7. Plan for Expert Group meetings (i.e., one in each corner of the room).
    1. Make a sign for each Expert Group (A, B, C, D) and hang one in each corner of the room.
    2. The group now becomes the “home group.” Within each home group, assign Expert A, B, C, D. Expert Cards B and C have less reading than the other cards, for differentiation purposes.
  8. Students should be seated in home groups of four to foster collaboration.
  9. Review entire sequence for clarity before prepping fossil activity. (Step 4 of Procedure)
    1. Prepare one tub for each group by filling with sand mixed with 2 different colored beads or other small objects (one color to represent fossil teeth and one color to represent modern teeth).
    2. Place a piece of tape across the horizontal center-line of the tub and another one across the vertical center-line of the tub to create quadrants.
    3. Decide what ratio you want your students to calculate in this location and place the appropriate number of beads in the tub that will represent modern shark teeth (x).
    4. Place a second type of manipulative in the tub that will represent fossil shark teeth (y).
    5. Cover with sand and stir (to simulate wave action).

All tubs in the classroom could be identical, but ideally, each tub should represent different locations for the same species, with slightly different ratios. (See Explore Step 4.f.iii for clarification.)

Part I

Engage (25 minutes)

Ask questions about data supported by evidence to determine whether fossil remains from sharks have changed through time and if the fossil record can provide us with reliable information about shark populations in the past.

  1. Review Lesson 8.1: Shark Encounters
    1. Remind students that in Lesson 8.1: Shark Encounters, they were exploring the idea that in recent years, shark encounters in the United States and around the world have been record breaking. White sharks were responsible for many of those encounters off the coast of California leading people to wonder about the potential causes for the increase. Remind students that they were left wondering how we can tell if the population has actually increased; to do that, we need a context for the normal or average population size. So, today they will try to determine that by digging into the deep past. Ask students to discuss the following in groups and then choose a few students to share with the class:
      • How do scientists learn research information about the past?
      • How would scientists know about shark history in the past?

  2. Elicit Prior Knowledge
    1. Remind students of our purpose, to establish if we are seeing more sharks today than in the past, fewer, or the same number. In order to do this, how do we know what “the same” is or if that has changed? What do we need to compare to today’s information? Discuss with students how we might establish whether something has changed. (We need a reference.) When students start describing a reference, ask for ideas about what could provide a reference for change; students should eventually conclude that we need information from the past to be able to make the comparison. Ask students to reflect on what they have learned so far this year. When we consider the past, students should recall that many populations (such as foraminifera) fluctuate when there are changes taking place in the environment. For a complete context with sharks then, we need to look into the deep past for sharks, a history dating more than 400 million years.
    2. Present the following scenario to students: Imagine you are a larval paleoichthyologist (someone who studies ancient fish, but larval, someone new to doing this work) taking a walk on the beach and you stumble upon a shark tooth along the high tide line. You are pondering shark populations and what you currently understand, but there are gaps in your information. You have an appointment next week to give some information to a news reporter about whether or not the shark population has increased, decreased, or stayed the same and they want your professional opinion. Ask students the following questions:
      1. “What questions do you need to think about (and even ask your colleagues) in order to understand shark populations of the past to be able to give context on the current population?”
      2. “What types of patterns or change in patterns related to shark populations (past and current) could identify cause and effect relationships that would help you make a determination about the past?”

      Ask students to record their questions in their Science Notebook. During a class discussion of questions, chart student questions on the Shark Population Questions Chart for use in the Explore activity.

    3. Some things students might ask:
      • Do sharks leave behind fossils? If so, what kind?
      • Where would we find shark fossils?
        • Would they always be underwater?
        • Where else might we find shark fossils?
      • What similarities and differences would you look for to help you determine if you found a new tooth or a fossil?
      • What information was missing from your explanation? (Use 8.1.C1: Shark Encounter Claim Chart as a reference.)
        • Did you have multiple pieces of evidence supporting each claim?
        • Was the evidence scientifically relevant?
        • Was there enough information to establish patterns? Establish cause?
    4. After recording in their Science Notebook, give students a few minutes to share with their groups and the whole class. As students share out their questions, be sure the conversation leads to a discussion of the lack of reasoning in the explanation(s) (why was that empty on their 8.1.C1: Shark Encounter Claim Chart?). How would information from their questions, and information we could possibly obtain from shark teeth, fill in this reasoning gap?
    5. The goal is for students to consider looking at the fossil history of sharks to determine a pattern of species diversity, population size, etc. Guide students to refer to claims they made in the previous lesson on 8.1.C1: Shark Encounter Claim Chart and “information needed to strengthen this explanation” section of the chart. Information from the past may help support one of the claims from the previous lesson–shark encounters today have increased, decreased, or stayed the same.

    TEACHER NOTE

    Work with student ideas about where they think they will find shark fossil teeth. One of the easiest ways for people to access shark fossil teeth is to go to the beach where many wash up at the water’s edge. To help students have a context for this, you can view the following video (show 0.17-2:20) Tips for Finding fossilized shark teeth! At the beach!

Part II

Explore (30 minutes)

Obtain and communicate information to determine whether fossil remains from sharks have changed through time.

  1. Create Expert Groups to Answer the Questions Generated Above
  2. To help them prepare for their interview, let students know that you have reached out to various experts to help better understand shark fossils (specifically, teeth, as that is the part of the shark that fossilizes) and construct a more complete explanation by getting a context for shark populations over time (in this case, we are considering time to be geologic time/ evolutionary history). These experts have information based on their questions.
    1. Distribute one set of 8.2.G1: Expert Group Cards to each group. Inform students that they will learn from experts on one of four topics, thereby becoming experts themselves.
      • Assign each student to an Expert Group and direct them toward the appropriate group sign.
        • As they read, invite students to record a big idea from the reading and any detail that would answer questions from the Shark Population Questions in their Science Notebook. (For classes that need extra support, consider having students meet in Expert Groups and read together; for example, all of the Expert As meet together, all of the Bs, etc., and then report back to their home group.)
        • Give groups time to share the big idea from the reading and information they feel would contribute to class understanding of questions they asked.
        • Remind students to use their 8.1.H2: Scientist Communication Survival Kit (from Lesson 8.1: Shark Encounters) to help with group conversation and to make sure everyone has a chance to share.
    2. Distribute a copy of 8.2.H1: Geologic Time Scale to each student and ask them to insert it into their Science Notebook.
      • Ask students to recall understanding of patterns and their role in prediction. (Give students a moment to discuss.) Remind students that Geologic Timelines provide a context of revealing patterns to support prediction of events.
      • Remind students that 8.2.H1: Geologic Time Scale indicates the approximate times of the 5 major mass extinctions (highlighted.) Draw students’ attention to these times and remind them that these mass extinctions are what separates the time periods. Geologists generally agree on the threshold of more than 50% of all species going extinct defines a mass extinction. This occurs when environmental factors (geologic and climate events) change so rapidly (within a relatively short period of geologic time) that that the ability of most species to survive and reproduce is compromised or there isn’t enough time for enough reproduction (enough generations) for populations to adapt.
      • TEACHER NOTE

        8.2.H1: Geologic Time Scale is simply a tool for students to use in order to analyze the relative length of time different species lived and the sequence of events that occurred. You can find 8.2.R1: Geologic Time Scale Key in the Toolbox.

        This lesson sequence is designed to be taught at the end of the year after students have learned about the geologic time scale and mass extinctions. If students do not have this prior knowledge, additional instruction may be required. One suggestion when teaching geologic time scale is to construct a classroom-sized geologic time scale model in which adding machine tape is attached to the walls of the room. String with index cards attached is used for labeling. Key events and time intervals, in years, are marked. (A suggested scale is generally 1cm = 1 million years). This provides students with a more accurate perception of the immensity of geologic time and patterns of climate and evolution. If this is already constructed in the room, students can attach special “shark cards” to the existing class geologic time scale as well as track on 8.2.H1: Geologic Time Scale.

      • Distribute one set of 8.2.G2: Time Scale Cards to each home group.
        • Instruct students to record information they find on their timeline in order to establish information about past shark populations. This should help explain the evolution of white sharks and determine the population size of sharks through time. (Note that the 8.2.G2: Time Scale Cards about White Shark Evolution has two references to the timeline for students to record.)
        • Groups shuffle the cards and turn them face down. One student draws a card and reads it, and then the group analyzes and interprets the data on the card in relation to their time scale.
        • When the group is in agreement as to where the information should be written, each member records the fossil information in the appropriate place on their timeline.
        • Direct students to use their Science Notebook to describe any patterns they see about the evolution of sharks and their relative position on the geologic time scale.
        • The person on the right draws the next card and the process continues until all of the cards have been drawn and read.
      • The readings should reveal patterns around diversification of sharks (an increase in different types of sharks over time), distribution of sharks (to worldwide), and fossils of shark teeth (the ones we find today are from “modern” sharks, not ancient).
        • Facilitate student analysis and discussion by circulating and asking the following:
          • What patterns do you see? (Expected responses include, Many different types of sharks appeared after each mass extinction. Sharks did not completely die out after every mass extinction. The appearance of sharks after mass extinctions changed greatly.)
          • If you see patterns, what is the evidence for them?
          • What do you predict will happen in the future? How does a pattern showing change help you predict what will happen in the future?
          • Does the pattern you see support the conclusion that...

          TEACHER NOTE

          For the questions above, students should be relying on evidence in the cards to establish patterns that lead to predictions. For students having difficulty, engage them in a discussion about what this means with all of the cards laid out to help with visually identifying the patterns, and together discuss appropriate predictions given the pattern under discussion.

          This sequence uses different descriptors for time. “The Past” is still describing the geologic/evolutionary history of sharks. Ancient sharks precede the Permian (about 290 MYA), with modern sharks in more recent history (origin being “first” and rise as the expansion of diversity). Earliest is used in reference to early shark fossils (the first fossils to have some traits similar to sharks) and white shark fossils to indicate that the fossils are old, but not so old they are considered ancient (geologically speaking). It’s all semantic! If students are confused, have a conversation about the words and ask students to think of a way to clarify the language for their use. Help language learners with selecting appropriate affixes (such as early/earliest).

        • The student recording of information on 8.2.H1: Geologic Time Scale is intended to give a scientist’s perspective of a time scale that’s too large to mentally conceptualize.
        • How long does the history of sharks span? And how long does that compare to other species?
        • How could we study sharks at this scale and how could we study shark teeth at this scale?
        • If you do not have a class scale model, ask: What scale model will help you to gain further insight?
        • Relate a question on scale that students asked on the Shark Population Questions Chart.
        • TEACHER NOTE

          One suggestion for teaching geologic time with students is to build a scale model of geologic time that can be hung on walls in the classroom. This is often done on adding machine tape (tickets, streamers, or toilet paper will also work); one million years of time can be represented by 1 cm. This could have been done previously in the year, and then used in this lesson. In addition to adding shark evolutionary history to 8.2.H1: Geologic Time Scale, students can add “shark cards” to the classroom scale model.

        • Students may wonder why, when whole groups of other animals became extinct, some sharks were able to survive. Ask them what they recall about food webs and niches. Sharks have a diverse diet and can move rather quickly to a different area, so many were able to find food, even when most living things were dying off. Plus, they evolved to fill various niches as other animals became extinct.
        • Remind students that although the mass extinctions appear to have happened quickly in the fossil record, they actually took thousands, if not tens of thousands, of years to occur.
        • TEACHER NOTE

          Use 8.2.R1: Geologic Time Scale Key to guide the discussion.

          Geologic time scales are often interpreted as having finite divisions between the time periods. This is not true. For example, mass extinctions are generally viewed as a distinct event occurring between two time periods. In fact, according to many geologists and paleontologists, the Permian Extinction occurred over the course of 15 million years during the late Permian period.

  3. Shark Teeth Sampling
    1. Remind students what they learned about shark fossils from their Expert Groups: how shark teeth are the only part of a shark that becomes fossilized, how shark teeth become fossilized, where they can be found, and how you can determine the difference between modern and fossilized shark teeth. Ask students to think about and share ideas of what shark teeth fossils could tell us. Chart the ideas that require us to make assumptions on the Shark Fossil Assumptions Chart.

      Possible student responses:

      • Open water shark behavior has not changed over time.
      • The proportion of modern sharks would need to be the same as the proportion of ancient sharks.
      • Each tooth represents one and only one shark.
      • Not all shark teeth become fossilized.
      • This window of time is the same of a modern shark.
    2. The geologic time is based on evidence such as fossil evidence. Facilitate a brief discussion to solicit student ideas about the type of information scientists have come to understand from this fossil evidence. Continue discussion until a student mentions that we might get an idea of population size. Inform students that we are going to attempt to use fossil evidence to determine ancient population size of sharks. Ask students to record in their Science Notebook what they recall about features of evidence that make for a quality argument. (Students should recall from grades 3–5 that they must distinguish facts from judgment and speculation, and from grades 6–8 that empirical evidence and scientific reasoning is used to support or refute an explanation.) After a few moments, ask students to share, making sure they are demonstrating knowledge about empirical evidence and scientific reasoning supporting or refuting an explanation. ( Ask students who struggle to recall the discussion in Lesson 8.1: Shark Encounters on what was needed for strong/quality evidence and reasoning and how they think that applies here.)
    3. Inform students that they will get a chance to see what it’s like to be paleoicthyologists by sampling an area where fossilized and modern shark teeth are often found. Have students envision scientists surveying an area of the “water column” and counting how many sharks pass through that area over a period of time. Scientists can then survey the sediment and collect the number of teeth in that same area. By comparing the observed sharks (for example, observations from drones) against the shark teeth found (both modern and fossilized), scientists can set up a ratio to predict the numbers of sharks in an area when they find a certain number of shark teeth.
    4. Provide a scenario; for example, in one area of Chesapeake Bay (where conditions are optimal for shark tooth fossilization), 75 sharks are observed and 3 modern shark teeth are found. In another area, 160 sharks are observed and 6 modern shark teeth are found.
    5. Use this data to determine the relationship, or ratio, of modern shark teeth to observed population. Based on the relationship, or ratio(s), suggested, ask students:
      1. How does this ratio help you see a possible pattern between the number of modern shark teeth found and the observed population?
      2. Using this pattern, how many modern shark teeth might one find if 450 sharks are observed?
      3. Using this pattern, how many sharks might be observed if 25 modern shark teeth are found?
      Ask students to record information in their Science Notebook.
    6. TEACHER NOTE

      If students don’t understand proportions and using patterns to solve math problems, these topics should be reviewed. Below is an example for students who need help specifically on problems in 4.e:

      Sampling example: We sampled the water column in nine areas and counted the number of White Sharks over a 5 year period, then calculated the average number of sharks in that water column (n).

      We then sampled the upper sediment and found x number of modern teeth. There is a proportional relationship between the number of teeth and the number of sharks.

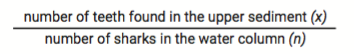
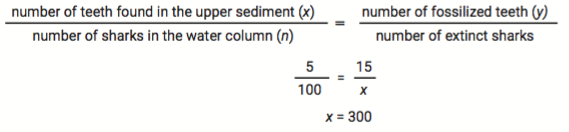
      We can use this same relationship to estimate the number of extinct sharks by sampling the lower sediment and finding the number of fossilized teeth (y) and setting up a proportion.

      In both of the Chesapeake Bay scenarios stated above, the proportional relationship is 4% for number of teeth to number of sharks.

      For example: 5 modern teeth are found in a sample and 100 sharks in the water column. In the deeper level, 15 fossil teeth are found. Estimate the number of extinct sharks in the water column.

      As an extension for students at a higher math level or for those wanting to explore, ask them to scale this up even further to estimate the number of extinct sharks there were in any ocean region.

    7. Inform students that they will be collecting a sample of shark teeth in the sediment of a new location that scientists think has potential for finding shark teeth where x number of sharks have been sighted. They will be collecting random samples of two types of beads, or any other assortment of two different manipulatives (perhaps beads for modern teeth, marbles for fossilized teeth) in different quadrants of the sediment (sand) using a cup. Encourage students to randomize how deep they dig into the quadrants with their cups to model how scientists collect teeth samples in sediment.
      1. First, tell students how many modern sharks have been sighted in this location (n).
      2. Students will be sampling their quadrant by sifting the sand for beads representing modern and ancient shark teeth (procedure described below in step h).
        1. a. Count modern teeth found in the quadrant (x).
        2. Calculate the ratio of modern sharks sighted to teeth found.
        3. Count ancient teeth found in the quadrant (y).
        4. Solve for ancient shark population.
      3. All tubs in the classroom could be identical, but ideally, each tub should represent different areas for the same species, with slightly different ratios. This sets the stage for student discussion around sample size and considerations of how they can make meaning from the different areas. (Students should eventually realize that an average ratio could do this.)
    8. TEACHER NOTE

      This sampling exercise allows students to see that the use of modern teeth is a way to estimate a modern population size as a proxy for predicting ancient population size. Since we cannot go back in time to count how many individual sharks there were in an ancient population, we can use the ratio of modern teeth to modern observed sharks to predict ancient population based on number of fossil shark teeth found. (A proxy is a preserved characteristic that can be a stand-in for direct measurement, and is important in science. For example, an ice core is a proxy for past temperature; the oxygen isotopes found in ice cores can give us a measure of temperature the year the snow fell even though we cannot directly measure the temperature that year.)

      When placing the manipulatives modeling modern and fossilized shark teeth in the tubs of sand, stir them around to randomize their placement in the sand. The amount of modern and fossilized teeth you put into each tub is determined by you, based on the scenario you provide (like the Chesapeake Bay scenario), being clear about the number of sharks sighted as this sets the ratio that is needed for predicting the estimated ancient shark population.

      This is written for students to “discover” the ratio and use it to determine the ancient shark population. In order to do that, students will need to know the modern shark population and work with the data in their table to figure it out. If you prefer, you could instead provide the ratio (similar to the one given in the Chesapeake Bay scenario) and have students just use that to determine the populations for both modern and ancient shark populations.

    9. Instruct students to think about how they will organize their findings. Suggest that they prepare a data table in their Science Notebook titled Shark Teeth Sampling, and ask students to use this to track the data they collect.

      Students should generate their own data table, but a sample, such as the one below, can be provided for those that need guidance. (Consider simply making the table accessible to students who want/need to see it so they can build it in their Science Notebook, rather than printing the table.)

      Shark Teeth Sampling

      Group
      Quadrant
      Modern Teeth
      Modern Shark Population Estimate
      Fossilized Teeth
      Ancient Shark Population Estimate
    10. Model for students how scientists would randomly select a “study site”: flip a coin to find a vertical quadrant location (heads = top and tails = bottom), and flip a coin again to find a horizontal quadrant location (heads = left and tails = right). This will be the quadrant you will be sampling. Then model for students how to sample (get a cup and scoop the quadrant), and how to collect data (pour out the sample onto a newspaper or a tray) and record the number of color A bead (modern teeth) and color B beads (fossilized teeth) in your data table.
    11. Give groups time to sample and collect data (as described above).
    12. Once the students have determined the data for their group, ask students to share their data and chart for the class on the Shark Teeth Data Chart.
    13. To help students make sense of their data and to make sense of this phenomenon, ask students to think about the following and discuss with their group:
      1. What do you notice about the different percentages?
      2. What information is provided by the patterns in rates of change as seen on the chart?
      3. What cause and effect relationship(s) can you identify based on the pattern in the data on the chart?
      4. What assumptions did you make to come up with this conclusion? (Note the assumptions listed on the Shark Fossil Assumptions Chart and others that were new to you.)
      5. Can we use any patterns in this data from the chart to determine the number of sharks in the water? Why or why not?
      6. This technique only gives us relative population size; what is meant by relative?
      7. What type of data would you need to gather in order to help you more accurately determine the number of sharks in the water column?
    14. TEACHER NOTE

      To differentiate the questions for students, all students should work with questions i, ii, v due to their general nature. Questions iii and vii are looking for relationships and, therefore, require application of general knowledge. For students that would like/need to dive deeper into the material and tackle something more challenging, suggest that they think about and discuss iv and vi as they require more application of knowledge to a system and a greater understanding of mathematical concepts to apply an understanding of what relative means.

    15. Following the discussion, ask students to write a reflection in their Science Notebook on a couple of key questions from above. (Consider suggesting questions iii. and v.) Allow for partner discussion for students needing language support.

      Some possible assumptions that students could come up with include the following:

      • Sharks do not stay in one place.
      • Fossils are not easily found.
      • Favorable conditions are needed for fossilization.
      • Sharks lose multiple teeth over their lifetime.
      • Sharks today are similar to sharks in the past. Oceanic conditions today are similar to those in the past.
    16. Once students have had a chance to discuss the questions with their group, share responses with the class.
    17. TEACHER NOTE

      This portion of the lesson reveals an important nature of science connection for students as they attempt to make sense of the phenomenon. Science assumes that objects and events in natural systems occur in consistent patterns that are understandable through measurement and observation. That being said, shark tooth fossil data is inadequate for estimating population size because too many assumptions must hold true. Many times, problems in science (such as, what was the ancient shark population) can’t be solved by experiment and you are limited by what you have access to. Have a brief discussion with students to see what their thoughts are. If students reveal in the discussion that they aren’t understanding this important point, adjust instruction. Asking questions such as, “What exactly did you observe? What were you looking for? Why were you looking for this? What is limiting your explanation? What is making you unsure? What would need to be different for you to be confident in the data? ” may help, as well as providing an example from an experience students may have in their own lives. (An example could be to ask students to consider a time they were given a wrapped present. How could they know what was inside without opening it? Think of similar ways they might gather data and what assumptions they would need to make to decide.)

Part III

Explain (35 minutes)

Analyze and interpret data to find patterns of shark diversity extinction, and changes in life forms on a geological time scale.

  1. Make Sense of the Data
  2. Prompt students to consider what they have learned in this lesson. (Students may use the charts generated and their Science Notebook.) Ask them to discuss with their group and then record how they are making sense of the following in their Science Notebook. Before students begin work, inform students that you will be peeking into their Science Notebook to give “sticky note feedback.”

    1. What is a new understanding you have of shark life history over geologic time?
    2. From the data you collected, what do we know for sure and why?
    3. From the data you collected, what questions do you have and why?
    4. What is a limitation in the data?
    5. What data would be useful to increase understanding of past shark populations and why?
    6. How does this connect back to our anchoring phenomenon, Numerous reports suggest an increase in white shark encounters in the United States in recent years and the public is worried? What is one thing you now know and two wonderings you are left with about the phenomenon?
    7. I used to think ______ and now I know ______

      Examples of sample student responses:

      • I noticed from the ratios in the different sampling tubs that there were always more modern teeth than ancient.
      • A question I have is how many ancient sharks were present where the ancient teeth were found so we could compare the ratios.
      • It looks like, over time, there is more and more diversity of sharks, but how else do we know that besides studying fossil teeth, which forces us to make a lot of assumptions?
      • Depending on how many teeth there are, you can possibly determine the number of sharks. But sometimes, the number of teeth cannot accurately determine the number of sharks because sharks don’t stay in one place.
      • Consider if one shark dropped multiple teeth, and we were counting each tooth as one shark; that would lead people to a false conclusion.
      • The type of data that would help me is numeric data, where you see the numbers either going up or down.
      • One way to capture data that would help me more accurately determine the number of sharks over time is to put a camera in one area and see how many sharks pass by.
      • We really just need better data where we don’t have to guess things.
      • I don’t think this was useful to help us figure out if the white shark population is increasing.
      • I used to think fossils could tell us everything about sharks in the past, but now I know it’s hard to know for sure.

  3. Leave Feedback
  4. When students are finished, take time to read Science Notebook responses and leave sticky note feedback. Return Science Notebooks to students and ask them to review the feedback and, if helpful, to discuss questions they may have with their group. After discussing any questions, ask students to consider the feedback and refine their work. Ask students to identify their revisions in some way so that you can check on their progress.

    TEACHER NOTE

    When students are finished, take time to read Science Notebook responses and leave sticky note feedback. Return Science Notebooks to students and ask them to review the feedback and, if helpful, to discuss questions they may have with their group. After discussing any questions, ask students to consider the feedback and refine their work. Ask students to identify their revisions in some way so that you can check on their progress.

    • Formative Feedback: Using the method of sticky note feedback is a way to encourage students to modify thinking, given input from a teacher or peer. Feedback should be constructive to give students a pulse on their progress in making sense of phenomena and building 3D understanding, and can give direction where they are on target as well as how to improve. Using a sticky note (rather than writing directly on the student notebook page) sends a signal that the teacher or peer respects that the notebook work is the student sense-making space and belongs to the student.
    • Grading: While the Science Notebooks are not graded, products that use evidence from the notebooks could be. Such products might include an informational paper or a claim with multiple lines of evidence from hands-on investigations documented in the student’s notebook. These formal products provide opportunities to address English language arts goals, such as writing for different audiences and for different purposes.

    For more information on this, see: Tyler, B., & DiRanna, K. (2018). Next Generation Science Standards in practice: Tools and processes used by the California NGSS Early Implementers. San Francisco, CA: WestEd. Retrieved from http://www.k12alliance.org/docs/NGSS-In-Practice-Report_FINAL.pdf.

Accommodations

The Engage activity connects students’ past learning and experiences about the geologic time scale to the present lesson. Most students own or have seen shark teeth and that experience can be recalled as they begin the lesson. By writing about the topic in their Science Notebook BEFORE discussing, second language learners and low language students can gain confidence and organize their thoughts before speaking in front of a group. Also, sharing ideas in small groups throughout the rest of the lesson lowers the affective filter of low language students. To support students learning English, allow conversations and notebook work to happen in the language that the student is most comfortable expressing understanding, and then encourage expression using simple English phrases (or more complex for students with increasing proficiency). Having students work in teacher-selected partnerships or groups allows the teacher to match students in a way that they are being supported. Allow advanced or motivated students to have the opportunity to explore additional questions that arise.

References

Amy’s Traveling Shoes. (2014, July 31). Tips for Finding fossilized shark teeth! At the beach! [Video]. YouTube.

Averianov, A. (2014). Review of taxonomy, geographic distribution, and paleoenvironments of Azhdarchidae (Pterosauria). ZooKeys, (432), 1–107. Retrieved February 24, 2020 https://www.ncbi.nlm.nih.gov/pmc/articles/PMC4141157/

Ehret, D. J., Macfadden, B. J., Jones, D. S., Devries, T. J., Foster, D. A. & Salas-Gismondi, R. (2012), Origin of the white shark Carcharodon (Lamniformes: Lamnidae) based on recalibration of the Upper Neogene Pisco Formation of Peru. Palaeontology, 55(6): 1139-1153. doi: 10.1111/j.1475-4983.2012.01201.x

Fanti, F., Minelli, D., Conte, G. L., & Miyashita, T. (2016). An exceptionally preserved Eocene shark and the rise of modern predator–prey interactions in the coral reef food web. Zoological Letters, 2(9). Retrieved February 24, 2020 https://www.ncbi.nlm.nih.gov/pmc/articles/PMC4818435/

Helfman, G. & Burgess, G. H. (2014). Sharks: The Animal Answer Guide. Johns Hopkins University Press: Baltimore, MD.

Martin, R. A. (2003). Evolution of a Super Predator. Biology of Sharks and Rays. Retrieved February 24, 2020 http://www.elasmo-research.org/education/evolution/evol_s_predator.htm

National Aquarium. (2017). Sharks: Survival of the Fittest. Retrieved February 24, 2020 https://aqua.org/blog/2017/July/Sharks-Survival

Pauliv, V. E., Dias, E. V., Sedor, F. A., & Ribeiro, A. M. (2014). A new Xenacanthiformes shark (Chondrichthyes, Elasmobrancii) from the Late Paleozoic Rio do Rasto Formation (Paraná Basin), Southern Brazil. Anais da Academia Brasileira de Ciências. 86(1): 135–145. Retrieved February 24, 2020 http://www.scielo.br/pdf/aabc/v86n1/0001-3765-aabc-86-01-135.pdf

Sanders, R. (2009). Bone Bed Tells of Life Along California’s Ancient Coastline. UC Berkeley News. Retrieved February 24, 2020 https://www.berkeley.edu/news/media/releases/2009/06/08_sharktooth.shtml

University of Florida. (2018). Fossil Shark Basics, Florida Museum of Natural History. Retrieved February 24, 2020 https://www.floridamuseum.ufl.edu/fish/discover/sharks/fossil-sharks/basics/

University of Florida. (2018). Fossil vs Modern Shark Teeth, Florida Museum of Natural History. Retrieved February 24, 2020 https://www.floridamuseum.ufl.edu/discover-fish/sharks/fossil/shark-teeth/

Resources


Download 8.2.G1

Download 8.2.G2

Download 8.2.H1

Download 8.2.R1