
NGSS Design Badge
Awarded: Nov 5, 2020
Awarded To: Understanding White Sharks

This learning sequence is positioned at the beginning of the last instructional segment identified for California Middle School Integrated, grade 8, in the California Science Framework (essentially, the end of middle school). Important Disciplinary Core Idea (DCI) prior knowledge students bring to this learning sequence from grades 6–8 includes
This learning sequence primarily serves to help students to extend understanding of wave properties, deepen understanding of waves and information technologies, and begin to build an understanding of magnetic and electric fields (students will receive much more detailed instruction later in the instructional segment) with a subtle nature of science storyline focusing on the value of interpretation of data in science and its role in framing knowledge (science is a way of knowing, scientific knowledge is based on empirical evidence, scientific knowledge is open to revision in light of new evidence). Set in the context of tracking sharks, with the integration of life science (how we learn information from the fossil record) and Earth science (human impacts), students begin to build understanding of the anchoring phenomenon of the possible increase in encounters with white sharks and subsequent public concern. It is recommended that students have prior instruction on wave properties (just wavelength, amplitude, and frequency) when they study astronomy-related DCIs earlier in the year, as this sequence will provide students the opportunity to see those properties play out with tracking devices. (It’s possible for this to be addressed in this sequence, but the authors felt that to do so in a way that fosters adequate student sensemaking would take even more time in an already long sequence and deviate too far from the anchoring phenomenon.)
As this is the end of middle school, students should be at middle school level proficiency for SEPs and CCCs, although this sequence will reinforce a few. Throughout the sequence, students will be prominently using many elements of Asking Questions and Defining Problems, Developing and Using Models, Analyzing and Interpreting Data, and an intentional scaffolding of Constructing Explanations throughout which will ultimately lead to students Engaging in Argument from Evidence as they decide how to influence public perception of white sharks. Cause and Effect is the strongest CCC at play where all elements are used by students (with some elements of Patterns and Structure and Function).
The anchoring phenomenon for this unit is exploring a potential increase in white shark encounters and subsequent public concern: Numerous reports suggest an increase in white shark encounters in the United States in recent years and the public is worried. To explore this, students begin with past history and seek to understand what information fossil evidence and fossil records provide with respect to past evidence of shark life history in an attempt to establish a baseline. Realizing fossil evidence and fisher logs provide information that is unreliable or highly variable, students turn to evidence from modern tracking devices, which provide real-time evidence of shark life history. Students uncover that sharks have highly sensitive electromagnetic senses. They also realize that tracking devices emit magnetic fields and rely on wave technology to transmit and receive information that will produce a digital signal. Tracking white sharks is no easy feat when a researcher is on a boat with a shark in the water; there are differences in how surfaces absorb, reflect, and transmit light making it difficult to precisely locate and estimate sizes of white sharks. Students dig into primary literature to apply understanding of their studies specifically to the white shark population off Southern California and make predictions about the East Coast population. Empowered, students turn their attention to the public to address specific concerns.
The scope of the learning sequence helps students understand that tracking technology has given us a greater understanding of white sharks and how human activity (through legislation and policy) has positively impacted young-of-the-year and juvenile white sharks in Southern California’s nearshore nursery waters, resulting in an overall increase in the white shark population some 30 years after legislation began to go into effect. As a result, this sequence supports opportunity for deepening environmental literacy through the following California Environmental Principles and Concepts:

Principle 2
People Influence Natural Systems
The long-term functioning and health of terrestrial, freshwater, coastal, and marine ecosystems are influenced by their relationships with human societies.
Principle 3
Natural Systems Change in Ways that People Benefit from and Can Influence
Natural systems proceed through cycles that humans depend upon, benefit from, and can alter.
Principle 5
Decisions Affecting Resources and Natural Systems are Complex and Involve Many Factors
Decisions affecting resources and natural systems are based on a wide range of considerations and decision making processes.These principles can be applied most effectively to Lesson 1: Shark Encounters, Lesson 3: Fisher Logs, Lesson 9: Sharks and Humans, and Lesson 10: White Shark Public Service Announcement. For more information on California’s Environmental Principles and Concepts, see http://www.californiaeei.org/abouteei/epc/ and their complementary connection to the NGSS, the 2016 Science Framework for California Public Schools Kindergarten through Grade 12, Appendix 2 https://www.cde.ca.gov/ci/sc/cf/scifwprepubversion.asp.
Throughout the sequence, students drive the learning and are expected to be the architects of
their sensemaking. The teacher facilitates this process by offering opportunity for questions,
supporting, and redirecting when necessary. Throughout the sequence, a flag ( ) denotes
formative assessment opportunities where you may change instruction in response to students’
level of understanding and making sense of phenomena. The sequence also provides direction
where summative assessment opportunities arise.
) denotes
formative assessment opportunities where you may change instruction in response to students’
level of understanding and making sense of phenomena. The sequence also provides direction
where summative assessment opportunities arise.
The Performance Expectations (PEs) addressed in this unit are:
| MS-ESS3-4 | Construct an argument supported by evidence for how increases in human population and per-capita consumption of natural resources impact Earth’s systems. |
|---|---|
| MS-LS4-1 | Analyze and interpret data for patterns in the fossil record that document the existence, diversity, extinction, and change of life forms throughout the history of life on Earth under the assumption that natural laws operate today as in the past. |
| MS-ESS1-4 | Construct a scientific explanation based on evidence from rock strata for how the geologic time scale is used to organize Earth’s 4.6-billion-year-old history. |
| MS-LS4-6 | Use mathematical representations to support explanations of how natural selection may lead to increases and decreases of specific traits in populations over time. |
| MS-PS2-3 | Ask questions about data to determine the factors that affect the strength of electric and magnetic forces. |
| MS-PS2-5 | Conduct an investigation and evaluate the experimental design to provide evidence that fields exist between objects exerting forces on each other even though the objects are not in contact. |
| MS-PS4-2 | Develop and use a model to describe that waves are reflected, absorbed, or transmitted through various materials. |
| MS-PS4-3 | Integrate qualitative scientific and technical information to support the claim that digitized signals are a more reliable way to encode and transmit information than analog signals. |
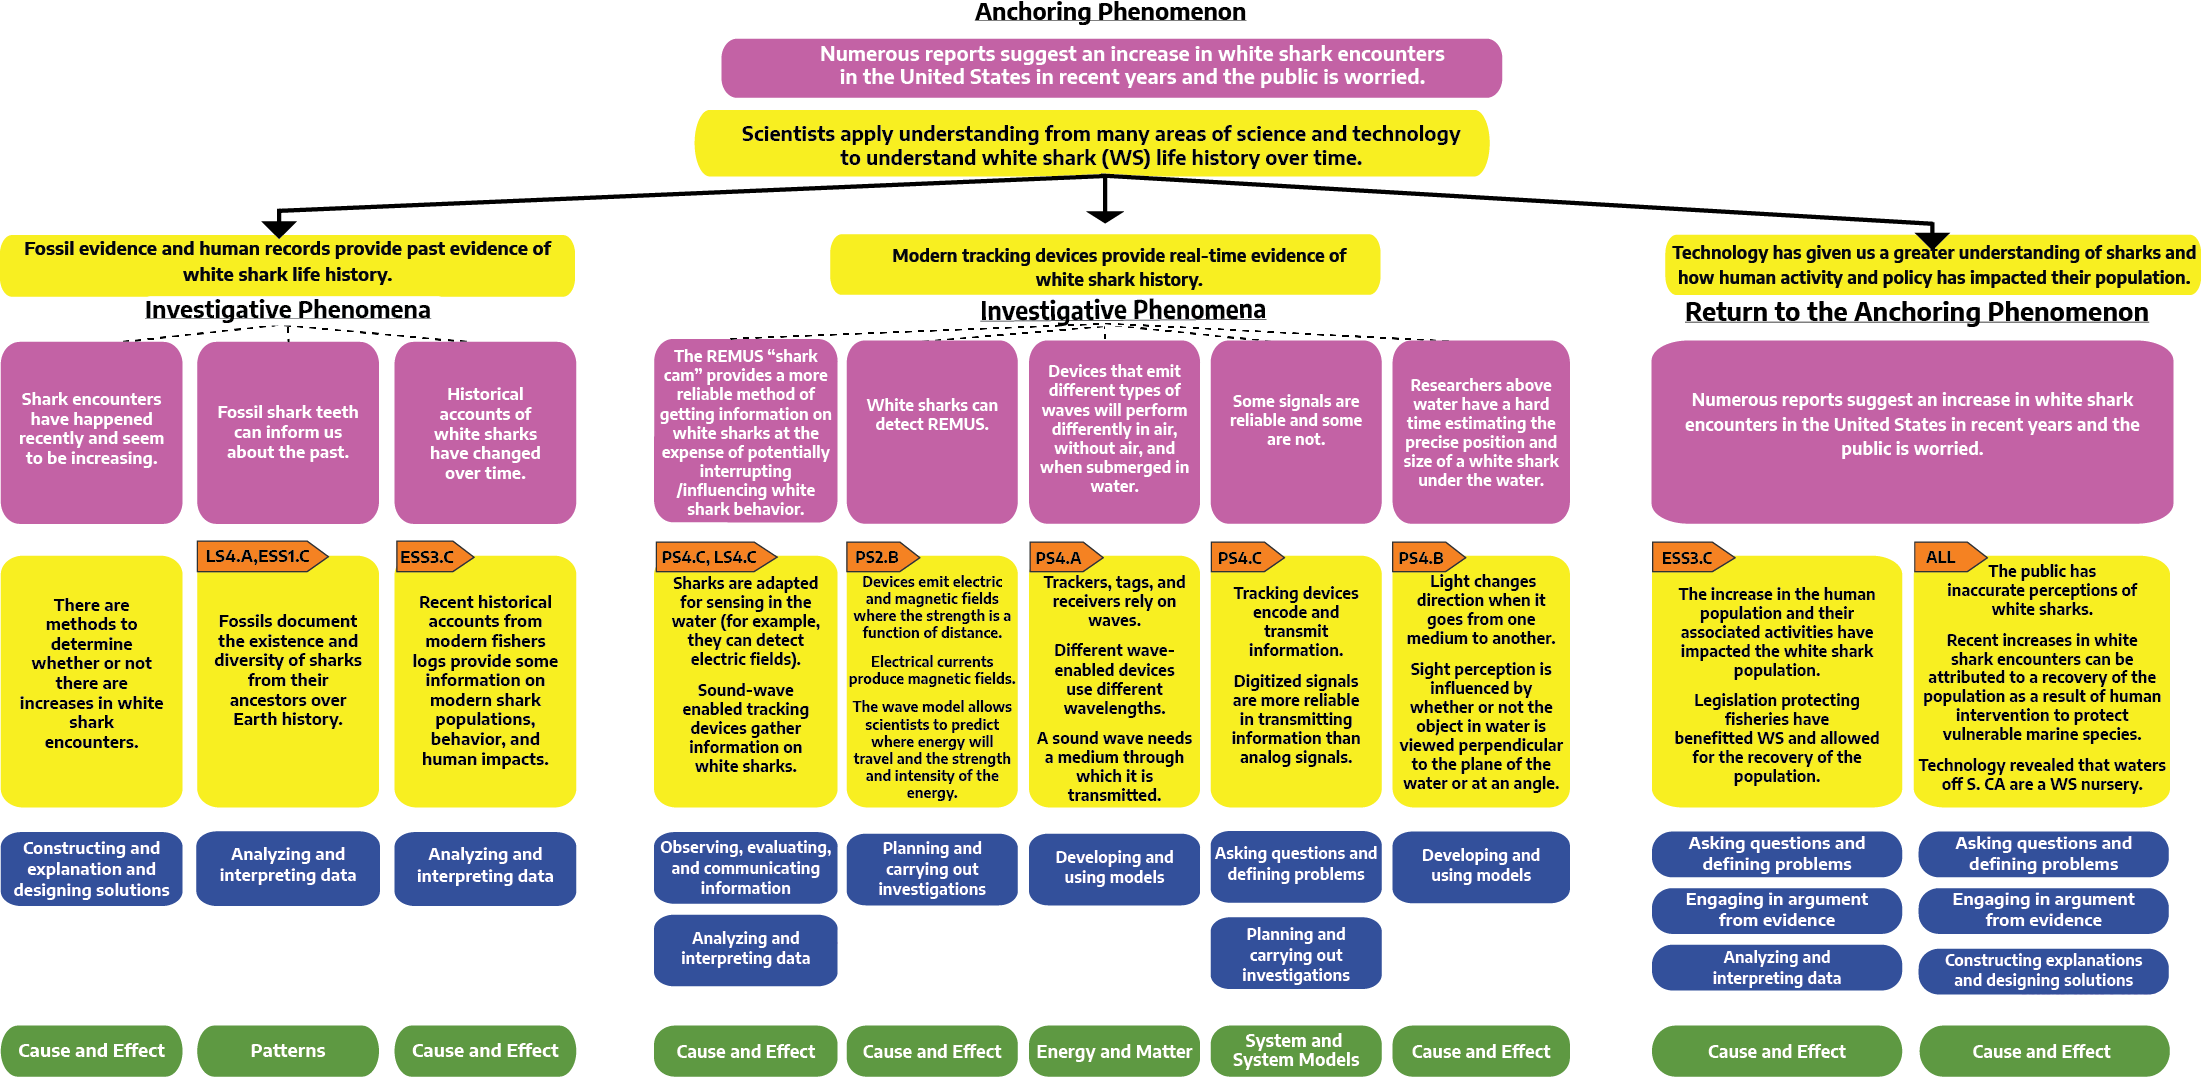
The Learning Sequence Narrative briefly describes what students do in each lesson and links the learning between the lessons as a conceptual storyline. At the end of each learning sequence, students make connections to their understanding of the investigative phenomenon (and to the anchoring phenomenon if appropriate).
The investigative phenomena for the learning sequence are:
Students figure out these phenomena by:
Asking Questions and Defining Problems
Developing and Using Models
Planning and Carrying Out Investigations
Analyzing and Interpreting Data
Using Mathematics and Computational Thinking
Constructing Explanations and Designing Solutions
Engaging in Argument from Evidence
Obtaining, Evaluating, and Communicating Information
ESS3.C: Human Impacts on Earth Systems
ESS1.C: The History of Planet Earth
LS4.A: Evidence of Common Ancestry and Diversity
LS4.C: Adaptation
PS2.B: Types of Interactions
PS4.A: Wave Properties
PS4.B: Electromagnetic Radiation
PS4.C: Information Technologies and Instrumentation
Patterns
Cause and Effect
Scale, Proportion, and Quantity
Systems and System Models
Energy and Matter
Structure and Function
Stability and Change
The following Learning Sequence Narrative is based on the conceptual flow concept map above.
This lesson introduces students to the anchoring phenomenon of the learning sequence (Numerous reports suggest an increase in white shark encounters in the United States in recent years, and the public is worried.) and a real-world investigative phenomenon (Shark encounters have happened recently and seem to be increasing.) that they can investigate. Students use their prior knowledge to share their own ideas about sharks and deepen their ability to ask questions based on observations from text to consider how they can distinguish fact from fiction. Students build on their abilities, in the 6–8 grade band, to analyze and interpret data to provide evidence for a phenomenon by questioning the sufficiency of the data they find. They use patterns to identify cause and effect relationships that are used to begin constructing an explanation about whether or not there are really more shark encounters now than in the past, relying on cause and effect to help them identify that the phenomenon likely has more than one cause. Following this lesson, students will have an opportunity to answer their questions about whether or not the amount of shark encounters in recent history is different from the past and what historical data suggests by analyzing fossil evidence and fisher logs on white sharks.
This lesson is part of a series in the learning sequence that will culminate in students revising an idea over time, leading to engaging in argument from evidence about the causes of recent increases in the white shark population with the goal of building public understanding and alleviating concerns.
Prior to this, students were introduced to the anchoring phenomenon of questioning the increased number of white shark encounters in the United States in recent years causing the public to worry.
Since this is positioned at the beginning of the last instructional segment for grade 8, it is expected that earlier in the school year, students learned about the fossil record, documenting the existence, diversity, extinction, and change in life forms throughout Earth’s history. They also learned that the geologic time scale is interpreted from rock strata to organize Earth’s history. This prior learning is recalled as students analyze evidence for white shark evolution and discuss ideas with peers. Students determine that sharks have been on Earth a relatively long time and species changed dramatically after every mass extinction. Species of sharks and the time periods they lived can be observed through fossils. Students mimic the investigation of this by using data to provide evidence for a phenomenon, using “random” sampling to look for patterns in rates of change and numerical relationships. Students come to the conclusion that although fossil evidence is useful in many circumstances for establishing the existence, diversity, extinction, and change in life throughout time, it is insufficient when attempting to determine past population sizes of white sharks because the data is insufficient as it relies on too many assumptions. This is the first time students consider assumptions to be a limitation of data, specifically fossil data. Although we can roughly estimate relative size, too many assumptions must be held to have a reliable measure (for example, only a portion of sharks fossilize–teeth; teeth are constantly being replaced; sharks do not stay in one location; etc.). This touches on an important nature of science theme, that the certainty and durability of science findings varies. This lesson is part of a series in the learning sequence that will culminate in students revising an explanation over time, leading to engaging in argument from evidence about the causes of recent increases in the white shark population with the goal of building public understanding and alleviating concerns.
In the next lesson students analyze how historic fisher logs provide information on changes in white shark populations. They learn how humans have impacted the marine environment through legislation and how this affected the white shark populations.
Prior to this, students investigated the history of white sharks as recorded in the fossil record and determined that shark population estimates cannot be made from fossil evidence. In this lesson, students learn about the population of white sharks as recorded in fisher logs and analyze graphical representations of data to identify temporal relationships. They read an adapted scientific text to describe evidence about fisher’s logs to clarify claims and findings. They realize, as consumption of natural resources increases with the rise in the human population, so do the negative impacts. They analyze patterns in the data to determine the cause of the negative impacts and learn about the effects of human intervention (through legislation). Although they are able to make some general conclusions, students realize that there are so many variables impacting the data in historical accounts that they are insufficient to fully explain the phenomenon. Finally, collaborative groups integrate quantitative information from written scientific text and visual displays of these accounts to obtain information and describe patterns and engage in early stages of constructing an explanation that includes quantitative relationships between variables to describe, at least, parts of the phenomenon (and will be built on in the next lesson and in lessons 9 and 10 of the learning sequence). This lesson is part of a series in the learning sequence that will culminate in students revising an explanation over time, leading to engaging in argument from evidence about the causes of recent increases in the white shark population with the goal of building public understanding and alleviating concerns.
In the next lesson students will be introduced to a modern technique that yields more reliable data: tracking devices. Students distinguish between aspects of the anchoring phenomenon and determine information needed to explain the phenomenon. This will lead them on a journey where they will learn about the physics behind tracking devices that allow us to better understand what is happening to the white shark populations and thus better understand their behavior.
In the prior lesson, students learned about white shark history and evolution in the fossil record and looked into fisher logs of shark landings to try and establish an idea of typical shark population size, only to encounter numerous frustrations with the inaccuracy of such methods.
This lesson begins by utilizing students’ increased sophistication of their understanding of asking questions around the need for a more accurate way to study white sharks by introducing students to REMUS (Remote Environmental Monitoring UnitS, an autonomous underwater vehicle). This leverages student opportunity to observe the phenomena, guiding their work to seek additional information. REMUS presents one way that scientists today are able to better study white sharks: tracking devices. Students begin to explore specifications of this technology, which brings new insight into the behavior of sharks, but also a new suite of challenges. Students are perceptive to the fact that white sharks interact with REMUS, potentially changing their behavior to do so, and demonstrate cause and effect knowledge (by using, from the 6–8 grade band, elements of cause and effect independently). They explore common shark adaptations that support successful survival and reproduction, but may present challenges in observing their natural behavior without detection.
This lesson moves towards altering student preconceptions about shark senses. In doing so, students begin to wonder, Can sharks detect electrical and/or magnetic fields emitted by a tracker, which will be explored in the next lesson.
Prior to this, students have learned about REMUS and how it’s deployed to study the behavior of white sharks. Additionally, they learned that electromagnetic reception was the primary method that sharks use to sense the world around them, leading students to wonder if white sharks are bothered by REMUS.
In this lesson, students will construct claims about the ability of white sharks to detect the electric and/or magnetic fields produced from REMUS. Students will be investigating the strength of a magnetic field that is produced by a current and how this magnetic field can interact with an additional magnet to create a motor. To do this, students plan and conduct an investigation to understand how fields are produced, decide on variables and measurements to be recorded, and utilize their understanding of modeling complex and microscopic structures and systems to help them visualize how their function depends on the composition and relationship among parts. They also analyze many complex natural structures and systems to determine how they function and apply understanding that structures can be designed to serve particular functions by taking into account properties of different materials. Students build on their understanding of magnetic fields by engaging deeply in arguing from evidence and compare and critique arguments on the same topic, provide and receive critique, and use evidence and scientific reasoning to refute an explanation.
In the next lesson students will learn how tags use acoustic (sound) and radio waves to transmit to a receiver, such as REMUS.
Prior to this, students applied understanding of how sharks have electrosensitivity to components of tracking devices. In learning this, students explored magnetic fields, currents, and the relationship between the two.
This lesson provides students the opportunity to conduct an investigation to learn more about the various types of devices used to track white sharks (those that transmit and those that receive information/data) and the influence of different mediums on the performance of the wave used by those devices. Students build iterations of a model, based on evidence, to show their understanding of both observable and unobservable phenomena and how differences in a system impact the phenomena. They use this model to show complex and microscopic structures and systems and visualize how their functions depend on the composition and relationship among parts and properties of different materials. The purpose of this lesson is to introduce waves in a context that is motivating for students, giving them a partial understanding of PS4.A (a sound wave needs a medium through which it is transmitted). Ideally, students would enter this learning sequence having a foundation in wave properties as they will be able to apply that knowledge to find deeper understanding here.
In the next lesson, students will explore the concept that digital signals are more reliable than analog and, thus, used in tracking devices.
In the previous lesson, students built an understanding that tracking devices that monitor white sharks use both acoustic (sound) waves and radio waves. They further explored that acoustic/sound waves attenuate in salt water and require a medium for transmission.
Students in this lesson embark on a journey of the development and application of wireless technology and compare wireless phones with tracking devices, considering reliability of signals and the encoding of information for transmission. Students practice with a binary code to understand how they can transmit a message and apply that understanding back to REMUS (and other tracking devices). They move on to understand that the tags that are on the white sharks, whose signals are picked up by receivers, begin as analog signals but are then encoded into digital signals before they are sent to researchers. Students are asked to consider which is the most reliable type of tag and which will have the most information by considering limitations of data. They will seek to improve precision and accuracy of data, and determine similarities and differences in findings. During this lesson, students apply understanding that systems may interact with other systems, may have sub-systems, and may be a part of larger complex systems. They will understand that models can be used to represent systems and their interactions, such as inputs, processes, and outputs and information flows within systems.
In the next lesson, students will consider the challenge of actually tagging a white shark for study and how aerial surveys of white sharks misreport shark size thanks to the phenomenon of light distorting our perception of objects.
In the previous series of lessons, students have explored various components of tracking devices, including magnetic fields, use of waves, and digitized signals.
It is in this lesson that students build understanding of the Performance Expectation for MS-PS4-2 by understanding that light (the same wave type as radio waves) does not change direction if the light hits perpendicular to the interface, and that it does change direction if the light hits at an angle. This is done through the context of scientists being challenged in estimating the precise position of a white shark when attempting to attach a tag. Light changes speeds when it transitions between mediums (in this case, from air to water), distorting the perception of where the shark is located. Students mimic this using a skewer and a gummy candy in a bowl of water. Students discover that when light hits the water at an angle other than 90 degrees, it looks “bent” due to the change in speed, therefore making it difficult to correctly perceive the position of a white shark’s location in the water. Students move on to more experimentation using lasers and objects of different densities and use patterns to identify cause and effect relationships that inform the development and modification of a model, based on evidence, to match what happens when a variable or component of a system is changed. Students apply this information to understand how aerial surveys of white sharks misreport shark size because light distorts our perception of objects.
In the next lesson, students will begin to understand one of the biggest revelations since tracking technology has been used to study white sharks–the tremendous impact humans have had on their population.
In the prior lesson, students explored features of light and how it interacts with different media to distort the perception of objects, making it difficult to tag sharks and accurately report size from aerial surveys.
In this lesson, students revisit the anchoring phenomenon (Numerous reports suggest an increase in white shark encounters in the United States in recent years) and the idea that humans have had a profound impact on the marine environment. The population of white sharks off the coast of Southern California, as studied by researchers, reveals the details of this story for students. Students analyze figures and the abstract from a landmark scientific study to piece together the history and construct their own explanation and sequence of events: that the vulnerable white shark population has benefited from decades of legislation to manage fisheries and protect coastal waters resulting in the protection of young-of-the-year and juvenile white sharks that utilize coastal waters as a nursery. Students apply their new knowledge to predict details about the Northeast Atlantic population to build an overall understanding of white sharks in general. Students independently choose crosscutting concepts that best facilitate the connections they are making and return to their iterative explanation from the beginning of the sequence to apply scientific ideas, principles, and/or evidence to construct, revise and/or use an explanation for real-world phenomena and events and apply scientific reasoning. At this point, scaffolds are removed and students must be able to demonstrate their proficiency within the 6–8 grade band of the elements of constructing explanations by establishing which data or evidence is adequate for the explanation or conclusion and why the data and interpretation of the data is appropriate. This explanation will become the basis of a public service announcement in the next lesson.
In the next lesson, students will apply their knowledge to help better inform the public about white sharks.
This is the final Evaluate of the learning sequence. Prior to this, students have learned about how data from tracking devices can help us understand relationships between human activity and white shark populations.
In this final evaluation, students consider the body of information learned throughout the unit. They are charged with considering how tracking technology has informed white shark research, and what information would be useful and important for an apprehensive public to understand white sharks. The overall learning goal is for students to engage in a process of argumentation, informed by the iterative constructing an explanation process (built over the learning sequence) and extensive use of cause and effect (especially in the context of influencing student discourse) and make a persuasive public service announcement (PSA). The goal of this PSA is to educate the public about what scientists today understand about white sharks, how we have acquired that information, and that our legislation geared to protect vulnerable marine species is working. The messaging should do three things: alleviate public concerns about the increase in the white shark population; convey that we should always use caution when entering their habitat; and explain that fears that are often exacerbated by the media and the public are unwarranted as Southern California is a nursery for baby white sharks (although very large, young white sharks are “fish eaters”), and the adults that pose a greater risk to humans tend to spend more time further offshore.
Students create a PSA targeted to a specific audience to address specific concerns, and independently choose crosscutting concepts that best facilitate the connections they are making. These PSAs provide an opportunity for students to show understanding of the phenomena during the preparation and delivery of an oral and written argument supported by empirical evidence and scientific reasoning to both support and refute explanations. PSAs can be scored as a summative assessment to the unit.


Katie Beck, High School Physics and Chemistry teacher, Garden Grove Unified School District
Jill Grace, Regional Director, K–12 Alliance @ WestEd
Chris Olivas, Middle School Math and Science Teacher, High Tech High Middle School
Sylvia Brown, Middle School Science Teacher, Vista Unified School District
Jill Grace, Regional Director, K–12 Alliance @ WestEd
Donna Markey, Middle School Science Teacher, Vista Unified School District
Marianna O’Brien, Middle School Science Teacher, Santa Monica Malibu Unified School District
Chris Olivas, Middle School Math and Science Teacher, High Tech High Middle School
Gina Rae Stolpestad, K–12 Science Coach, Long Beach Unified School District
Ali Gubary, Middle School Science Teacher, Aspire Public Schools
Brian Finley, Middle School Science Teacher, San Diego Unified School District
Chris Olivas, Middle School Math and Science Teacher, High Tech High Middle School
Jeremiah Potter, Middle School Science Teacher, San Diego Unified School District
Maralee Thornburn, Middle School Science Teacher, Tracy Unified School District
Brian Finley, Middle School Science Teacher, San Diego Unified School District
Lisa Hegdahl, Middle School Science Teacher, Galt Joint Union School District
Stephanie Sanchez, Middle School Science Teacher, Vista Unified School District
Dr. Christopher G. Lowe, Professor of Marine Biology and Director of the CSULB Shark Lab, California State University, Long Beach
Dr. Anthony E. Metcalf, Professor of Biology, California State University, San Bernardino
Meredith Casalino, Science Coordinator, Orange County Office of Education
Achieve Science Peer Review Panel
A Collaboration of the K-12 Alliance @ WestEd, Aspire Public Schools, Galt JUSD, High Tech High, Kings Canyon USD, Lakeside USD, Oakland USD, Palm Springs USD, San Diego USD, Tracy USD, Vista USD, Achieve, and the California Department of Education
with funding from the S.D. Bechtel, Jr. Foundation and Hastings-Quillin Fund
The California K–8 NGSS Early Implementation Initiative was developed by the K–12 Alliance at WestEd with close collaborative input on its design and objectives from the California State Board of Education, the California Department of Education, and Achieve. This project was designed to build local education agency (LEA) capacity to fully implement the Next Generation Science Standards (NGSS) as a core subject in the elementary grades (K–5) and as the SBE’s preferred integrated model in grades 6–8.
The six-year Initiative provided teachers and administrators with in-depth, content-rich professional development to build leadership capacity and teacher acumen to deliver high-quality 3-dimensional learning for K–8 students. In addition, through collaborations among the K–12 Alliance, Achieve, and others, the LEAs in the Collaborative have opportunities to pilot test new NGSS-aligned tools, processes, assessment item prototypes, and digital and other instructional materials. The LEAs continue to serve as resources for NGSS implementation across California, and in other NGSS-adopting states as well.
This resource presents the conceptual storyline for a unit of instruction at a specific grade level, then focuses on a portion of the storyline called a learning sequence. The learning sequence uses the 3 dimensions of the NGSS (disciplinary core ideas‐DCI; science and engineering practices‐SEP; and crosscutting concepts‐CCC) to build and deepen student understanding of natural phenomena and design challenges.
Participants in the CA NGSS K–8 Early Implementation Initiative developed and field-tested the lessons in the learning sequence. The sequences were vetted by Achieve using the EQuiP tool and found to be aligned with the intent of the NGSS.
NGSS Lead States. 2013. Next Generation Science Standards: For States, By States. Washington, DC: The National Academies Press.
A Framework for –12 Education: Practices, Crosscutting Concepts, and Core Ideas.DOI: https://doi.org/10.17226/13165. National Research Council; Division of Behavioral and Social Sciences and Education; Board on Science Education; Committee on a Conceptual Framework for New K–12 Science Education Standards. National Academies Press, Washington, DC.