


Sewage water is consumed by people, but they do not get sick.
Develop and use models and recognize patterns to describe the materials that are in the Town Water Samples.
Water collected from a town may be contaminated. The town officials are requesting help to design a process that will identify the particles in the water and then clean the water.
Click here for NGSS, CCSS–ELA and Math, and California ELD standards.
In the previous lesson, students were introduced to the problem that the town water might be contaminated. Students created a model of possible contaminated water and created questions to help them understand more about the contamination and to generate an engineering design to fix the contamination.
In this lesson, students use their investigation questions to identify the presence and amount of contamination, reinforcing the idea that particles that are too small to be seen exist in the water. They continue to revise their models and create new ones to explain their understanding. Students also review and add to their design questions about ways to clean the water.
In the next lesson, students explore their investigative questions about the properties of the material. This will assist them in designing their plans for cleaning the town water.
There are multiple models used in this lesson. To help keep track of them, this is a list of how they are used. During:
Step 1: Review their table group models of the Town Water Samples from Lesson 1.
Step 4: Create an initial model of cups A and B.
Step 9: Revise the models of cups A and B to include unseen particles identified with the indicator.
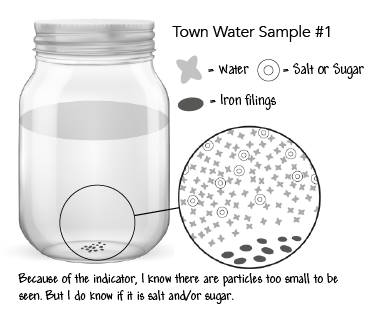
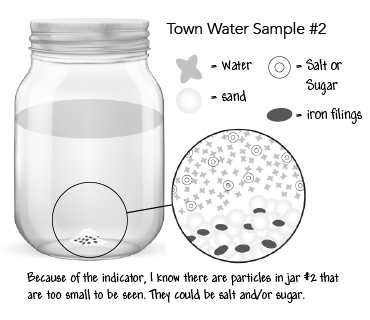
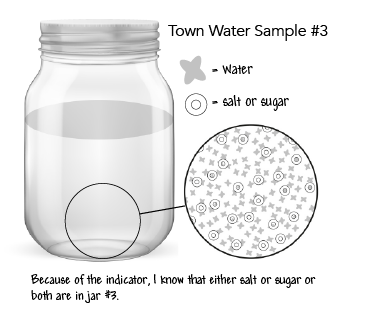
Step 14: Revise table group models of the town sample jars showing unobservable particles in jars #1, #2, and #3 but not #4.
Step 26: Investigate parts per billion (ppb) and develop new models on the worksheet showing parts per billion.
Step 27: Revise table group models of the town sample jars now showing parts per billion.
Step 30: Assess students’ development and use of models for understanding parts per billion.
Step 32: Develop models for their evidence in board presentation.
| Part I | 20 minutes | Engage |
| Part II | 30 minutes | Explore 1 |
| Part III | 30 minutes | Explore 2 |
| Part IV | 25 minutes | Explore 3 |
| Part V | 50 minutes | Explain |
| Part VI | 60 minutes | Elaborate |
| Part VII | 30 minutes | Evaluate |
If local water district data and reports are available for your location, you could substitute local data for 5.2.H1: Analyze This. Another option would be to invite a guest speaker from your local water district to present the data to your students.
If bleach and phenolphthalein are not available, you can substitute using the materials in this table.
| Ingredient | Cup A | Cup B |
| Vinegar + Bromothymol blue | Water = blue | Water + Vinegar = green/yellow |
| Bleach + Cabbage juice | Water = red/purple | Water + Bleach = green |
Communicate information and identify patterns in the materials that are in the Town Water Samples.
Conduct an investigation using an indicator (cause and effect), to determine if there are contaminants in the water.
 Show the two glasses of water, one marked A and one marked B, that you prepared in the Advance Preparation. Ask student pairs to use what they know about making models to draw in their science notebook a model of what they see in the two glasses. As students draw their models, look for them to depict these ideas:
Based on the scaffolding needs of the students, you may need to provide a template for the model which includes the glasses already drawn and a checklist of the items to be included on the model (shown in the bulleted list above).
Glass A will remain clear while glass B will turn bright pink. If vinegar and bromothymol blue are used, the glass A will turn blue and glass B will turn green/yellow. If bleach and cabbage juice are used, the glass A will be red/purple and glass B will be green.
The liquid in glass _____ turned _____ (effect) when the indicator was added because _____ while the liquid in glass _____ did not change because _____.
Cause-and-effect events have causes that generate observable patterns and can be used to explain change. It is important for students to consider this crosscutting concept to help them formulate questions that can be investigated.
Obtain information from media about the cause and effect of contaminants in the water.
The video segment from 2:25–2:35 describes possible causes of contamination; segment 2:45–2:51 lists some contaminants; segment 2:51–3:00 describes possible health impacts.
If it’s necessary to provide greater student engagement, find a news clip or news article on water contamination for a local area with which students are familiar.
Obtain information about the scale, proportion, and quantity of the materials in the water.
The idea of using published materials leads to the Explain of this lesson. If this suggestion does not come up, guide the discussion to the idea.
The readability level is 6.2. Students should read or follow along as the article is read aloud.
Struggling readers can be provided more direct instruction on finding evidence as the article is read aloud to them. A discussion of key vocabulary and phrases to look for that suggest “matter is too small to be seen” can occur prior to reading; for example: cannot be seen, no color difference, no taste.
Example evidence:
Paragraph 1: Lead-tainted water has no unusual color, odor, or taste but can damage nerves in the body.
Paragraph 3: While lead in water can’t be seen or smelled, there are tests to detect it.
Alternatively, if local water district data and reports are available for your location, substitute local data for 5.2.H1: Analyze This in order to elicit greater student interest. Another option would be to invite a water district guest speaker to present the data to your students.
Analyze and interpret data to develop a model that indicates the scale, proportion, and quantity of the materials in the water.
Parts per billion (ppb) means there is one unit of a contaminant in one billion total units. Parts per billion indicate the mass of matter in a unit volume of water. Real-world examples of one part per billion (ppb) include:
| Write out the number | 15 |
| Then underneath it write the number | 1,000,000,000 |
| and address place value. |
There are several picture books that can be used to help students understand the concept of very large numbers. These include:
If students have never made orange juice from a concentrate, play the How to Make Orange Juice from Concentrate video.
Students may not be familiar with using eyedroppers and/or graduated cylinders for measuring volume. Demonstrate the proper use of an eyedropper/pipette. The tip is pointed towards but not in the water container, and the bulb is squeezed and then lowered into the water. Once in the water, the bulb is released, and water is drawn into the eyedropper. Without exerting pressure on the bulb, the eyedropper is lifted out of the water and held tip down into the graduated cylinder. Gentle pressure is used to squeeze the bulb so that a drop forms at the tip and is pulled out by gravity.
For more information on using a pipette, watch the first 40 seconds of Using a dropping pipette. But note that this video only demonstrates how to get fluid into the pipette and not how to use it to make drops. To make drops, you must use controlled, slight pressure on the filled eyedropper/pipette.
The graduated cylinder is used to measure (quantify) liquid volume. If students have not used a graduated cylinder before, demonstrate proper reading of the volume in the graduated cylinder by reading the bottom of the meniscus, or curve, of the water.
Evaluate and communicate information and argue from evidence (data and models) about patterns in the particles in the water.
Have students return to 5.2.H1: Analyze This and review the data for School B only. To assess students on their understanding of scale, proportion, and quantity, ask students to use a whiteboard or a piece of chart paper to draw one particle model of a glass of water coming from the drinking fountain at school B for room 215 and another particle model for the drinking fountain at school B by the door of room 200. Tell students this model does not need to be accurate (they do not need to draw a billion dots), but it should indicate their understanding of the differences by showing room 215 fountain has 2 parts in the same volume that room 200 has in 24 parts (or 1 part for room 215 to 12 parts for room 200).For more information about Talk Science and the discussion types, visit:
https://inquiryproject.terc.edu/shared/pd/TalkScience_Primer.pdf
https://inquiryproject.terc.edu/shared/pd/cc/DiscussionTypes.pdf
Ask partners to make a poster (or whiteboard) presentation for the Portland Public Schools board of education detailing the availability of safe drinking water at one of 3 specific school sites. Ask students to choose one of these three claims to support; do not include the information in parentheses as this is for your information:
Gallery walks and peer feedback suggestions are available in several resources, including: http://www.assessmentforlearning.edu.au/professional_learning/peer_feedback/peer_strategies_enhance.html.
Students should engage in constructive critiques and comments when providing feedback.
If possible, provide students with sample critiques that cite specific evidence which supports a claim and specific “wonderings” for any concerns.
Communicate information about the particles of matter (energy and matter) and apply it to the engineering design.
This is an opportunity for brainstorming and creative thinking by students to reflect on the difficulty of quantifying extremely small values. It also provides an opportunity to formatively assess student understanding of ppb. All answers are acceptable.
This prompt leads to the Lesson 3: Properties of Matter on identifying unique and quantifiable properties of matter in order to identify matter which is the next question to be addressed on the Design Solutions Question Board.
Adler, D. A., & Miller, E. (2013). Millions, Billions & Trillions: Understanding Big Numbers. New York, NY: Scholastic.
Clements, A., & Reed, M. (2006). A Million Dots. New York: Simon & Schuster Books for Young Readers.
Hwang, L. (2019, December 03). Analyze This: Real data on lead levels in school drinking water. Retrieved July 28, 2020, from https://www.sciencenewsforstudents.org/article/analyze-real-data-lead-levels-school-drinking-water
Michaels, S., & O’Conner, C. (2012). The Inquiry Project’s Talk Science Primer. Retrieved from https://inquiryproject.terc.edu/shared/pd/TalkScience_Primer.pdf
Read, D. (2013, August 22). Using a Dropping Pipette. Retrieved from https://www.youtube.com/watch?v=SvXAyuyAw-0
Satterfield, Z. National Environmental Services Center. (2004). What Does ppm or ppb Mean? Retrieved from https://www.yumpu.com/en/document/read/31186844/what-does-ppm-or-ppb-mean-national-environmental-services
Schwartz, D. M., & Kellogg, S. (2012). How Much is a Million? Place of publication not identified: Paw Prints.
State of New Jersey Department of Environmental Protection. (n.d.). Scientific Method “Testable Questions” Worksheet. Retrieved from https://www.state.nj.us/dep/seeds/airqed/SAMP/questions.pdf
Strategies to Enhance Peer Feedback. (n.d.). Retrieved July 16, 2020, from http://www.assessmentforlearning.edu.au/professional_learning/peer_feedback/peer_strategies_enhance.html
TERC. (n.d.). Four Discussion Types. Retrieved from https://inquiryproject.terc.edu/shared/pd/cc/DiscussionTypes.pdf
Texas Commission on Environmental Quality. (n.d.). What is a Part Per Billion? Retrieved from http://www.tceq.texas.gov/assets/public/remediation/superfund/jonesroad/ppb_chart.pdf